In my last article, I shared with you why you want to connect MailChimp and Google Analytics and how to do it. This article is going to show you how to track your MailChimp campaign and how to see MailChimp tracking in your Google Analytics dashboard.
To get started, begin a MailChimp campaign like you usually would. The first screen of the MailChimp email campaign will ask you to choose the audience to which you want to send the campaign. Select your audience and move on to the next screen, which is Campaign Info.
The Campaign Info screen is where you’ll tell MailChimp that you’d like Google Analytics link tracking enabled for this campaign. Below the Google Analytics tracking box you’ll see that MailChimp will assign a tracking title for you, but I think it is easier to understand the tracking in Analytics when I give each campaign a meaningful name of my own. I try to name the campaign something distinctive and give it a date; this way I can easily remember the campaign if I am looking at my data months or years later.
![]()
After you send your MailChimp campaign, you’ll want to see what your website visitors did on your website in response to your email marketing efforts.
To do this, begin by logging into your Google Analytics account.
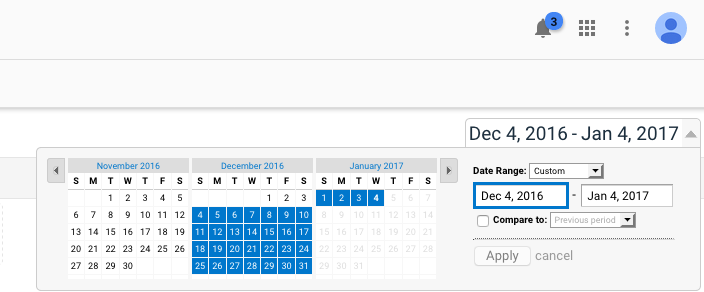
Next, adjust your date settings to be sure they include when your campaign was sent to whatever ending date you are interested in. You can adjust your Google Analytics’ date range in the upper-right corner of the Google Analytics Reporting Dashboard.
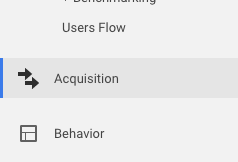
Next, from the left-hand navigation, click once on Acquisition.
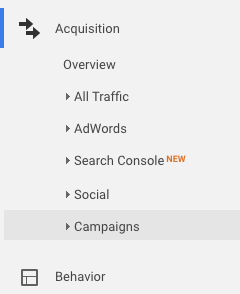
Next, click on Campaigns.
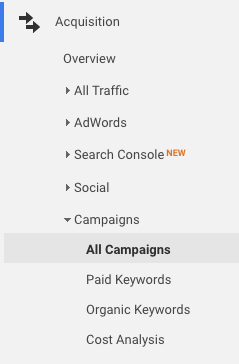
Next, click on All Campaigns.
Within the main area of the screen, you will see a column labeled “campaigns.” This will show you the names of all of your campaigns.
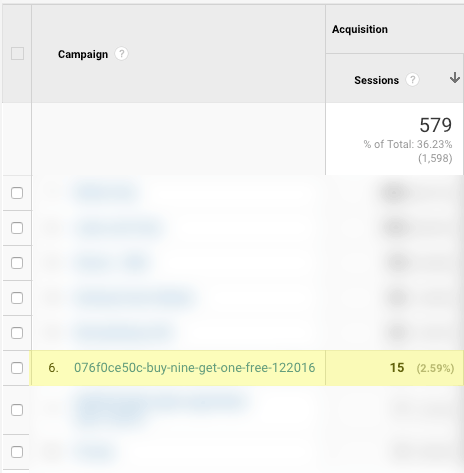
When you find the campaign name you are interested in, it will have a bunch of information for you in its row. From this row, you can learn:
-
Bounce rate.
A “bounce” is when someone views one page on your site and leaves. So in the case of an email campaign, it likely means they clicked on one link within your email, visited the one page on your site, and left the site. Generally, a lower bounce rate is better because it is an indicator that people are interested in your content enough to look around at your site. If you think in terms of a physical storefront, a bounce is similar to a passerby deciding not to enter a store after looking at its storefront. You definitely want your storefront to get people interested enough to walk into your store; it’s the same with your web content. You want whatever content you are highlighting in your email marketing to be interesting enough to get people to look at more content on your site.
-
Pages / Session.
This tells you, on average, how many pages a visitor viewed during one session, on average. If they clicked on a link from your email and then viewed a total of five pages and then left your site for more than 30 minutes, that would count at five pages viewed in one session. More pages per session is normally a good thing.
-
Average Session Duration.
This tells you how long a session lasted for each visitor from your email campaign, on average. Longer session durations are normally what you are looking for.
-
Ecommerce Conversion Rate.
If you have e-commerce tracking set up in your Google Analytics, you’ll be able to find out the percentage of sessions that converted to sales as a result of your MailChimp campaign. So if you received 15 sessions from your email campaign and 2 sessions resulted in sales, you would have a 13.33% e-commerce conversion rate.
-
Revenue.
If you have e-commerce tracking set up in Google Analytics, you will also see how much your orders amounted to as a result of your MailChimp email campaign.
Leave a Reply