Trying to figure out what to blog about can stop a blogger in their tracks. It has for me. However, if you’ve had content on your website for a while and you have had Google Analytics installed, you have a muse waiting for you. You just have to know where to look inside Google Analytics to help you figure out what to blog about next.
In order to use Google Analytics to help you figure out what to blog about, you need to have Google Analytics installed. I shared how to install Google Analytics on your website in my last article; read it by clicking here.
Now that you have all that taken care of, let’s start with how to use Google Analytics to figure out what to blog about.
First, find out what pages people visit the most on your site or blog by using Google Analytics.
Before I show you how to find this in Google Analytics, you should know that there are some pages I am going to tell you to pay less attention to, like your home page and contact page. In this scenario, we are looking to see what pages on your site are interesting to others to use as a roadmap for more content ideas. Your home page is frequently general. Your Pricing, About, and Contact pages are usually not about a specific concept. When I look for inspiration for what to blog about next from my own Google Analytics, I want to see the pages and posts that dealt with specific topics.
If you have website stats installed within your website’s dashboard, that’s great, but actually going to Google Analytics will give you the most similar screenshots to what I’m about to show you. Also, you’ll probably have more data and display options than you will within your website’s dashboard.
Begin by going to Google Analytics http://analytics.google.com
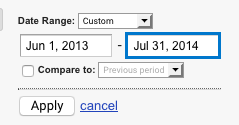
Once you are signed in, change your date range. You’ll do this in the upper-right corner of Google Analytics (shown below). I think changing the date range is useful because by default Google Analytics will show you the last 30 days and looking at trends over a longer period of time is more telling than just the month. I usually set my date range to at least three months of information. If there’s a particular time when you were blogging a lot in the past, you might want to go back to a window around that time to see what got traction. For instance, I did a survey of website builders back in 2013. I created around 50 posts in the span of a few months. I think it could be very useful to check a couple date ranges in Google Analytics related to these posts. I’ll start by looking at a 12-month span of traffic that begins when I started writing the website builder reviews. The reason for 12 months is it will tell me the most popular articles over a long period of time. After looking at this data, I’ll then look at newer data and compare to see which articles held interest and got traffic over time.
After putting in the beginning and end dates be sure to click Apply.
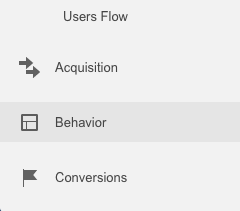
On the left-hand side of the Google Analytics dashboard, I’m going to scroll down to the Behavior heading. Watch out, as the word “behavior” shows up twice: Once within the Audience section (we don’t want to look at that “behavior” for this example) and then again, much lower you will see Behavior as a heading for its own section; it is below Acquisition. That’s not confusing, at all, is it? Here’s a screenshot of where to click:
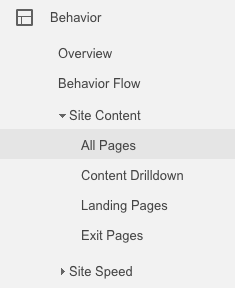
Once you find the Behavior section, click it. A menu will open up. From that menu, choose Site Content. From within Site Content, click All Pages:
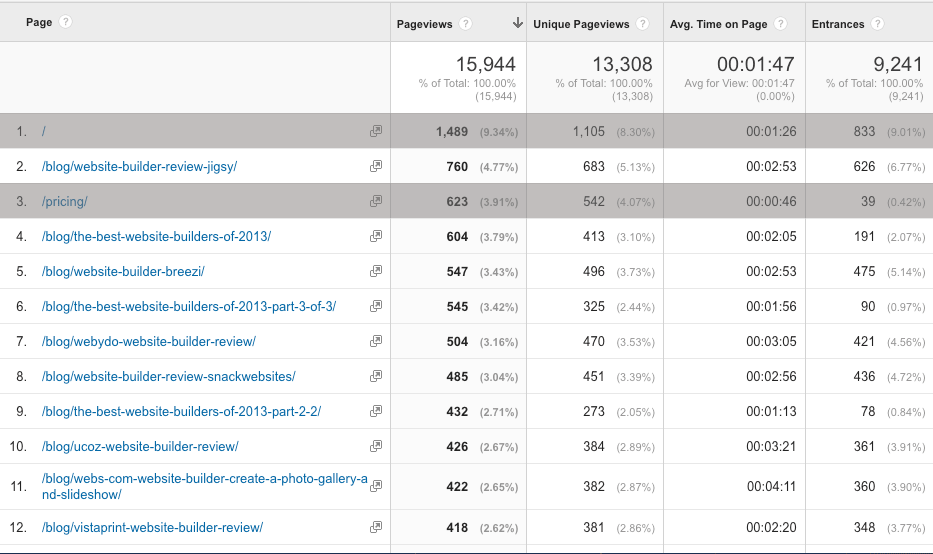
Remember how I said there would be pages I want to ignore in Google Analytics for this example because I’m interested in figuring out what to blog about, so I want to only look at pages that revolve around specific topics? Well, if you look at my screenshot below, you’ll see two rows that I have grayed out. The first one, /, is my home page. The other is a page about my pricing for my services. Neither of those will give me insight into what to blog about because those are general pages on my site that talk about the business.
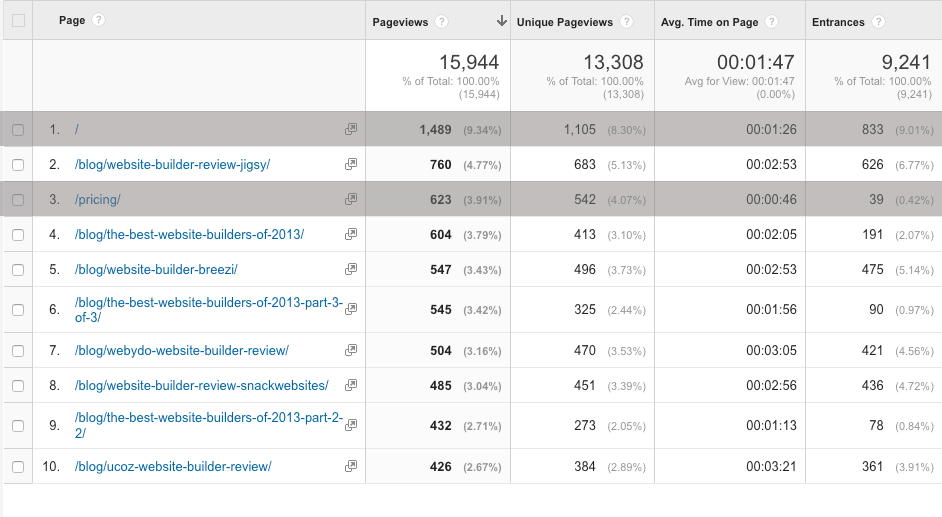
I’d like to see about 10 pages, if possible, to get ideas. Right now, in the screenshot above, there’s 8 pages that are articles. I’ll want to expand the number of pages listed. To do this, I’ll click the Show Rows button and increase my rows to 25. The Show Rows button is in the lower-right hand corner of my Google Analytics screen, shown in the screenshot below.
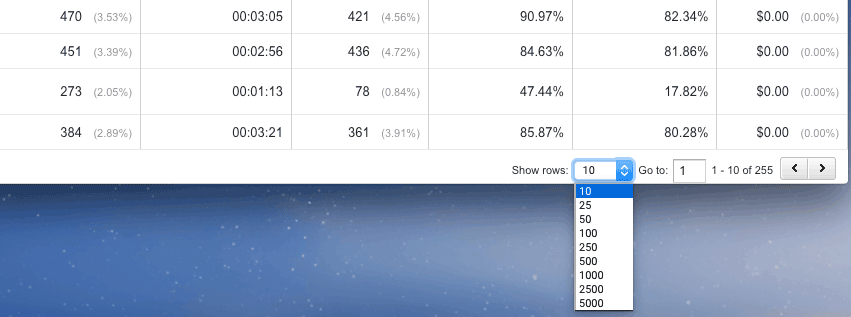
I chose 25. In the screenshot below, I’ve cropped out anything beyond the 12th row. I just want to see my top 10 blog articles from when I started heavily writing content. You’ll see that my “best of website builders” from 2013 were popular. All three show up in the list as having the most pageviews, even though they were some of the last blog posts I wrote. This might be a clue to do another series like that now for 2016.
Another thing to note is that the website builders that got the most pageviews on my site were website builders that aren’t as well known. More well-known website builders were probably too hard for my up-and-coming site to rank really well for since lots and lots of blogs do reviews about them.
Let’s fast forward to now. Do any of these old articles (3 years old now) still make it into the top 10 for pageviews?
Here’s what my stats look like for the last three months (June 1, 2016 – August 30, 2016). I’ve cropped out everything except the blog posts that were written back in 2013. Sure enough, some are still ranking after all this time. You’ll notice that the last one has the row number of 18. There’s about 8 generic pages that weren’t blog posts that I didn’t consider in the top ten (like home, contact, services pages, etc.).

So just off of this, I can see that people are still interested in Snack Websites’ website builder. They are also still looking for tutorials for Webs.com And people are still interested in Band Vista’s website builder.
I’d like to show you other ways to consider your data in Google Analytics besides just Pageviews. Usually, I’ll make note of a few more stats, like Unique Pageviews, Avg. Time on Page, and Entrances. So let’s have a quick look at comparing those as well to help consider what I might blog about next and why those stats matter.
Pageviews is just that. It’s how many times the page has been viewed. Here’s an example: On Monday, Suzie reads my Snack Website builder review and then she looks at my Home page and then she finishes up her visit on my site by returning to the Snack Website builder review again; Snack Website builder will have two Pageviews recorded. Pageviews are an indication of how interesting a page is, for sure, but the numbers should be compared to Unique Pageviews to get an idea of how many unique visits a page received to round out the picture as to how popular a page or blog post is.
Here’s a comparison of the blog posts that got the most unique pageviews then and which of those blog posts still rank in the top ten blog posts for unique pageviews now.
Then – 2013
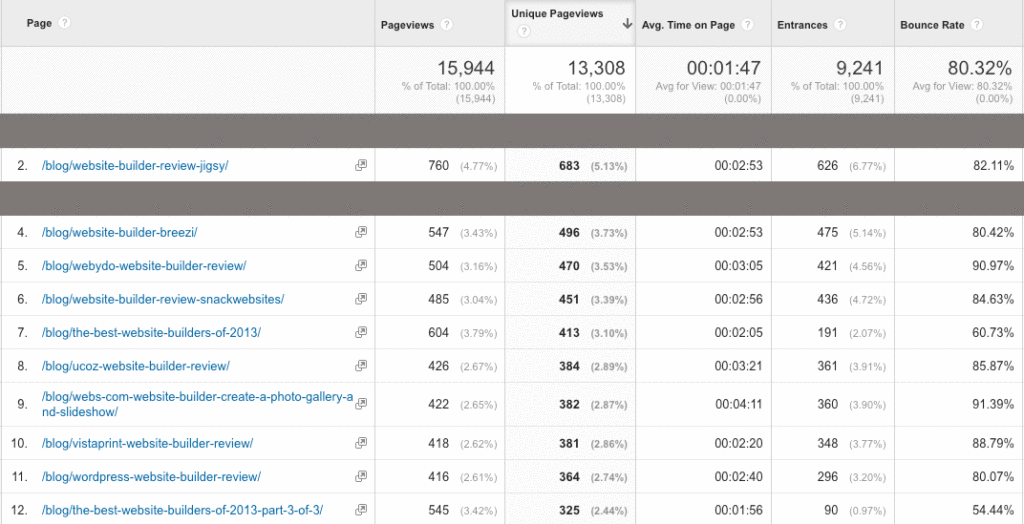
Now – 2016

Snack Websites builder review and Webs.com tutorials were in the top ten then and now for Unique Pageviews and Pageviews. So, right here I have enough data about what to blog about from Google Analytics that I could stop and write some new Webs.com tutorials or go check in on Snack Websites and do a new, updated, website builder review.
Another statistic to look at that we can see in the screenshot above from 2016 is the Entrances column. The numbers are exactly the same as Unique Pageviews. What does this tell me? People are finding these blog posts in search results and entering my site from them. If people were finding these blog posts after they were on my site, the Unique Pageviews would be higher than entrances. So this lets me know that while people are interested in the three blog posts in the above screenshot, they aren’t digging through my site to find website builder reviews or tutorials after viewing other other content on my site. And that makes sense; the website builder review project was a survey so I could be more knowledgeable about the website builder options out there. Based on what I see here, I know that there is still an interest in website builder reviews and tutorials, so if this topic still interested me I could probably get a lot of traction quickly by writing new website builder reviews and tutorials.
I’d also like to have a look at the blog posts that people spend the most time reading. From this I might see the same blog posts as above or I might learn that something I wrote back in 2013 is still really interesting, even if it doesn’t get a ton of views. Why dig further? Well, it takes time to look at all this data. I’d love more than a couple ideas to help me figure out what to blog about so I don’t have to go into Google Analytics all the time. Depending on how much information I get during one review, I might end up with enough blog ideas to keep me going for quite some time.
So if we just look at the time people have spent on my blog posts from June – August, 2016, here’s the blog posts from 2013 and later (yes, later) that people still spend a lot of time reading.
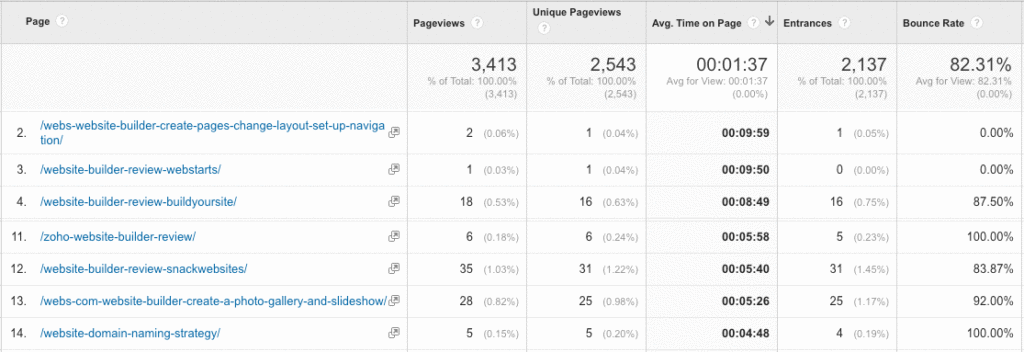
Again, Webs.com tutorials and the Snack Website Website Builder review comes up in the top ten blog posts. The last one in the screenshot above is an even older article I wrote about choosing a website domain name. These posts actually are getting read. So not only do I get clicks, for them, but people find them valuable enough to spend time reading. I should probably, at a minimum, put some sort of call to action in these posts to direct people to newly-updated content and I should probably write more blog posts about these topics.
While we’re on this last screenshot, notice the last column, Bounce Rate. This column tells me if these blog posts are the only thing people read or if they read that posts and then look at other content on my site. The lower the Bounce Rate, the better. Now, this last column is one that I could learn from even more. Like where do they go, specifically? Are they reading more website builder reviews or are they looking at services pages? I’ll go into how to find those things out in a future article and I’ll share what I’ve done with that knowledge to help me figure out more blog topics.
But wait! There’s more you can learn from Google Analytics to help you figure out what to blog about. You can see all these things as well:
- What words people used in Google Search to find your site.
- What words your blog showed up for but didn’t get clicks for.
- What words your site did get clicks for and how many times.
- What your blog’s average position in the search engines are for each of the search terms people are using (whether you get clicks or not for those words).
- What people are searching for when they are on your site.
But there’s a catch. You’ll need to do some more configurations to Google Analytics to get this information. The next two things you’ll want to set up are Internal Searches and Google Search Console.
Leave a Reply