Do you ever wonder if your Google AdWords Remarketing efforts are actually working?
Recently, I began running Google AdWords Remarketing ads for a client. Not having implemented remarketing ads before, I had no idea what to expect regarding whether people would actually click on the ads and, more importantly, if they’d be engaged on the client’s website if they did click.
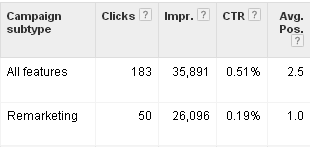
Here’s the resulting clickthrough rate and average ad position for the client’s search-based campaign and their remarketing campaign. These stats are pulled from Google AdWords. Also, it should be noted that since the information below comes from actual client accounts, all specific identifiers have been removed to maintain anonymity.

The “All features” row represents the campaign that holds all of the search-based ads in question, and the “Remarketing” row represents the remarketing ads in question.
The chart above shows that it has taken a lot more impressions for someone to click on a remarketed ad, as evidenced by the significantly lower click-through rate. However, the ad position is typically 1st place for the remarketing ad, and while I am not showing money spent by the client, I can share that the cost per click was significantly lower for the remarketing ads versus the search-based ads. I believe this is in part due to a very specific target for the client’s remarketing ads; I am not trying to show their remarketing ads to everyone who visits any page on their site. I am only targeting visits to very specific pages for remarketing.
Now let’s talk engagement. When the person clicks on a remarketed ad, are they spending time on our site? Are they viewing more pages? Let’s have a look.

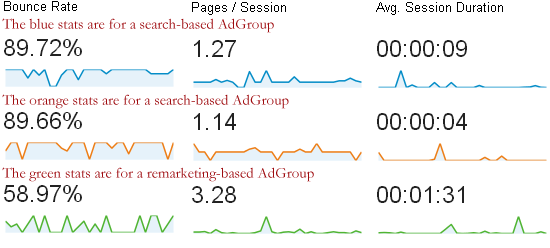
Holy buckets at the difference between a search-driven ad visitor and a remarketing ad visitor! The stats above shows that people who view the site via a remarketed ad are staying longer on average, viewing more pages, and are less likely to bounce.
If you’re not sure what is being said in the graphic above, the first column is showing the average bounce rate. Bounce rate means a visitor looks at one page on the site and leaves. There are three rows of bounce rates in the first column above. The first two rows shows what happens if a visitor comes to this site through a search-based AdWords ad and the third row shows what happens if a visitor comes to the site from a remarketed ad. Only 58.97% of the people who come to this site through a remarketed ad leave the site after one page view compared to the 89% rate from a search-based ad visitor.
The second column compares how many pages per visit, on average, a visitor looks at. And the third column compares how long, on average, a person will stay on our site.
The fun part about the stats above is like most things that are averaged, we get a slightly skewed perspective. The stats could look really good for remarketing due to some outliers, right? Wouldn’t it be nice to see a bit more in-depth information about the performance we’re looking at above? Sure it would. So let’s do that next.

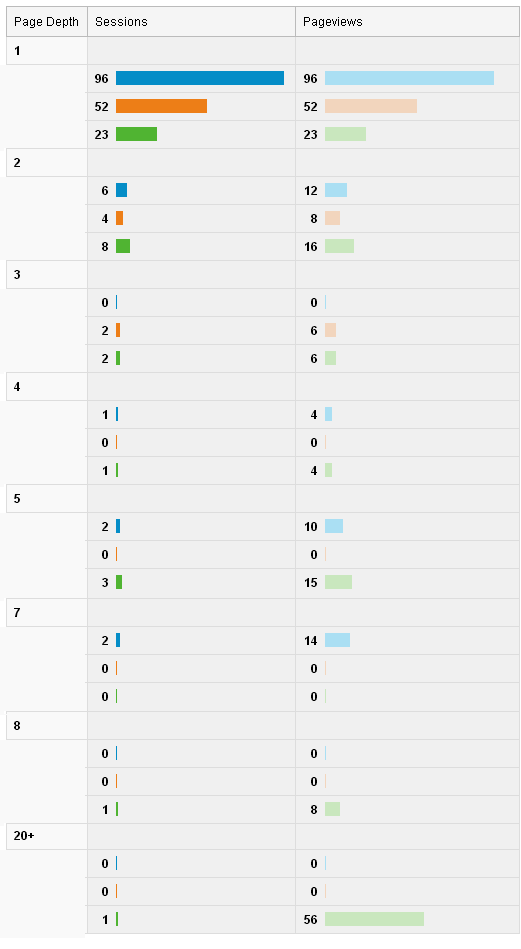
When reviewing the above engagement stats, we see a little more detail. First off, it should be noted that, as in the previous graphic, the first two rows of any group (blue and orange) are search-based ad visitors. The third row (green) are visitors to the website that came through remarketed ads. Another thing to be noted is that for the sake of keeping the graphic as short as possible, only page depths groups that received at least one visit are displayed.
This graphic breaks down pages per visits into groups. The first column, “Page Depth” tells how many pages were viewed, so “5” means that the visitors represented in this group viewed five pages each. The “Sessions” column tells us how many visitors viewed five pages during their visit. The third column, “Pageviews,” shows how many total pageviews resulted. So if there were 3 visitors that viewed five pages each, that results in 15 pageviews for the site.
What we can observe from this non-averaged based view is that the green group, the remarketing group, performed typically as well as or better than the visitors that arrived to the site from search-based ads.
All samples shown above were from a 30-day period. And after 30 days of running Google AdWords Remarketing ads, I think I am ready to do more with remarketing for this client. From the results, I am inferring that those who click an ad from the client after having already been to the site once are likely to be engaged in learning more about the client… Especially that one visitor who viewed 56 pages. 56 pages? Really? Who are you?
Does this mean we should give up our Google AdWords search-based marketing? No. Actually, I think it now gives us the power to leverage our Google AdWords search-based ads even more. In an upcoming post I will talk about the next strategy I’ll be implementing to get more mileage out of our search-based AdWords ads.
Would you like to know more about remarketing?
Check out this excellent article from Kissmetrics: How To Use Google AdWords To Reach The People Who Didn’t Click On Your Ad
Very good article.. Thank you for the same…
Thank you!